From small beginnings…
My history with data started when I joined my first company after graduating from University where I got introduced to data, back in 1996.

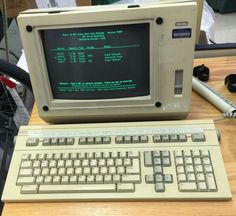
I started at the Computer Science Corporation (CSC) which had just outsourced the IT from British Aerospace. The role of a graduate programmer then, involved looking at data from a very different perspective from how we do today.
My role involved retrieving data and images that represented the handbook for the aircraft ground equipment. The data was stored in an old flat file data store called Adabass (“Adaptable database system”, first launched in 1971) and I had to collect it by writing a program code.
The interaction felt very mundane and there was a lot of code and the working of data arrays to obtain very little data. The process of collecting the data in the correct order would give the ability to print off the handbook and inspect my work. Many times I coded the wrong sequence only to see the print results being disastrous…
In the early days of my history with data I learned that user interfaces to display data were critical for the analysis process.
Getting hands on the data
With the introduction of client server architectures in the mid 90’s, the shift towards different storage mechanism’s for data began. The traditional central storage started to be replaced by more distributed instances of data stores where business departments would hold some of their own data.
The introduction of technologies such as MSAccess and Lotus 123 gave the opportunity for the business facing employees to hold their own data for their processes. I was thrown quickly into the deep end and helped design and write small business applications using these technologies to hold data.
The data was held in logical tables that were defined in the applications and given definitions for primary and foreign keys so you could establish relationships within the data. The advancement of data entry forms meant information was easy to capture and process and then interrogation was also made available through queries and reports. The ability to summarise with functions SUM, MAX, MIN and AVG meant we could easily make sense of the business information.
First steps
My first project with MSACCESS was on tracking some work orders around the various aircraft and meant we captured some budget and finance measures for work done. This was in fact a very rudimentary project tracking system which we were only just getting to grips with.
The volume of data was still small but was enough to start giving us some technical difficulties. A typical trick in those days was to split off the data and the function application into two separate MSACCESS databases to allow the focus on one to grow and help performance. This worked for a short time, but it became too apparent that data needed technology to allow it to scale and also provide a more resilient storage management.
Building on a good foundation
The initial versions of RDBMS databases were primitive but both Microsoft and Oracle allowed the capability to build but also manage the data storage technology. The ability to backup a database and restore gave the assurance that businesses were looking for and gave the developers the technical fallback. The friends of the developers were the Database Administrators (DBA) who were entrusted to manage the version of the databases and became the IT Department’s true heros in the days of lost data.
Many times they would be called upon to restore database data tables back to a version where the data was good. The nature and value of data started to grow as departments would store more and more important information to aid business processes. The emergence of specific systems to provide functions like order or invoice processing and financial control meant the databases started to grow rapidly. These small applications quickly grew in business and the history of data began to evolve with its use now at an enterprise level.
Joining the data
The value of data increased dramatically to business when it was able to be entered once and then passed between applications. This allowed the first automation of business processing with the data being passed through integration technologies to each application.
The initial methods for passing would consist of gatekeepers called interfaces that allowed data to be fed into an application from an external resource. Many times I would have to intervene as data would often get stuck in the interface for some validation reason. As a lot of the 90’s applications had basic information and held different values from each other it was often the case that data would not validate in the interface.
Plugging the gaps
Missing data from poor data entry meant the data could not be validated correctly. One example of this happened when I worked at a chemical company and supplier invoices were stuck in the interface because of missing billing address reference. We would have to update the data and retry the interface job again to create the payment invoice. This identified the need for data quality to be complete and correct to ensure businesses were paid on time.
Data became a key ingredient when finding what was going on with business operations. Soon the reporting on the number of invoices, sales orders, customer interactions to manufacturing processes all started to matter. The data was often queried from the applications database tables and the first sets of management reporting became a crucial way of managing the business operations.
When the values of financial costs associated with the business activity were summarised, businesses could get insight into winning and failing processes.
The need to centralise
When it was clear that activities needed constant monitoring, specific analysts were needed to bring the data together. Initial data marts were now enhanced to create data warehouses and the process of transforming data to a dimensional state was made to aid the analysis.
The Businesses that we helped over the years collected and processed data integration and stored it in a large database. Normally this was referred to as a data warehouse. This allowed the organisations to transform and model the data to allow it to give some business meaning. The OLAP (On-line data Analytical Processing) conventions over the years have varied slightly but were mainly following the same principles. They would simply transform the data into what was a de-normalised format of Facts and Dimensions data.
With the data being stored in a dimensional state the ability to see analysis of the factual data from many different view points was made available. With having the data modelled this way, we could easily aggregate totals of factual data up to the highest dimension. In most companies, the Product or service was commonly chosen as dimension and this aided the holistic view of measures such as sales by Product Category. The obvious key decisions were normally around which products to sell and which to stop.
DataEco helps you make sense of Big UK Data, allowing you to easily access, model, and visualise relevant data and insights.
Far too many businesses in the UK overlook the importance of data collection and analysis when it comes to their business strategies. Take a front seat in growing your business and sign up today to get deeper insights into UK businesses that take you further.
Unlimited subscription £49.99
Now only £35
For Limited Period
READY TO DIVE DEEPER?
One subscription, unlimited UK Company search and downloads.
Sign up to a simple membership plan that gives you unlimited access to predefined dashboards allowing for different analysis and views into critical sales and business intelligence.
Related Posts
February 19, 2024
Ownership insights with DataEco With recent news of tighter legislation being passed through the house of parliament the question that a lot of [...]
February 19, 2024
September 6, 2021
Check a Company Competitors with DataEco So how do you rank? With a lot of emphasis on survival in the last year, many companies [...]
September 6, 2021
May 19, 2021
Companies House Check with DataEco So what is the importance of Companies House? As the UK Company Regulator , it is the [...]
May 19, 2021
December 8, 2020
Ltd Company Check with DataEco So why do we have Limited companies and what is the difference? A ‘Ltd’ or ‘Limited’ company is [...]
December 8, 2020
November 30, 2020
Check UK Company Name with DataEco Save time, energy, and sanity with the only platform you need for finding reliable company data [...]
November 30, 2020
November 18, 2020
UK Company Search The way to perform a UK Company Search depends on the tools you use and how the data has been [...]
November 18, 2020
November 16, 2020
B2B Data Providers There has always been B2B data providers in UK in some form or another. The early days of acquiring mailing [...]
November 16, 2020
November 12, 2020
UK Economy Bounces Back Well it was the signs that we were looking for and for sure the UK Economy is bouncing back. [...]
November 12, 2020
October 29, 2020
UK Companies and Industries at Risk Well it' been a torrid year for all and the uncertainty of which UK Companies and Industries [...]
October 29, 2020
May 14, 2020
Segmentation of UK businesses A quick browse of the internet reveals countless articles and pages on ‘Marketing Segmentation’. Very few seem to focus [...]
May 14, 2020


